The numbers say the economy is fine. The data says otherwise.

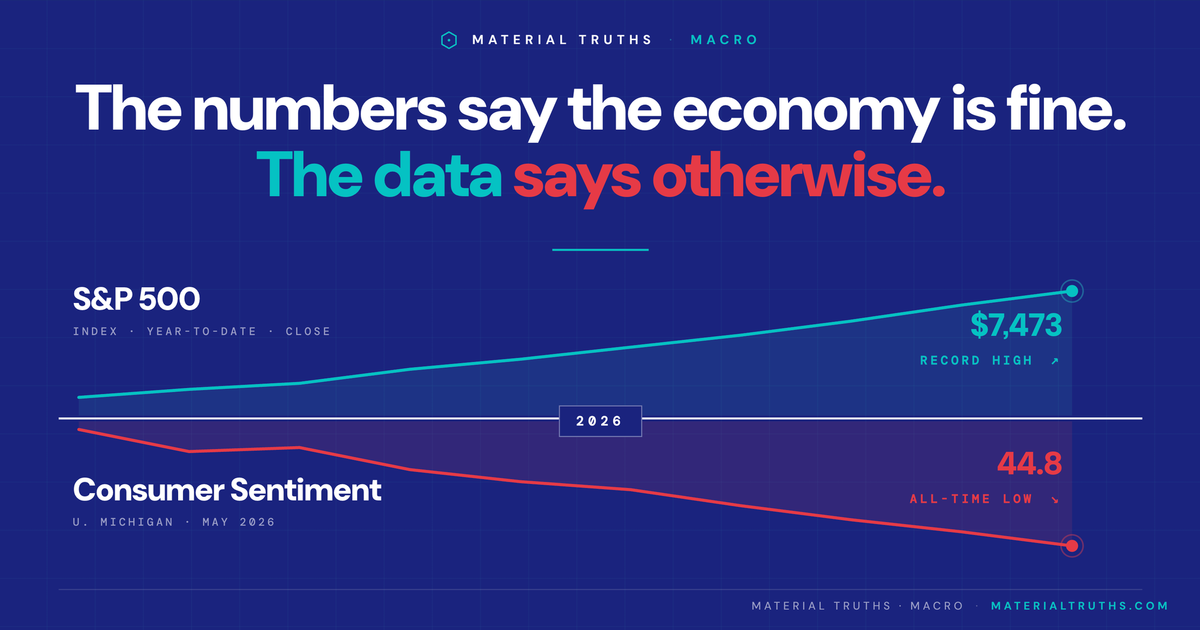
The S&P 500 just hit an all-time high. Consumer sentiment just hit an all-time low.
Both are true at the same time, in the same country, in the same week. The official numbers say the US economy is fine: 4.3% unemployment, 2.0% GDP growth, markets at record highs. The data underneath says something else entirely. Auto loan delinquencies sit at the 2008 financial crisis peak. There is $1.25 trillion in credit card debt compounding at 21% interest. Office real estate defaults just set all-time records. Consumer sentiment is lower than it was during 1980 stagflation or the 2008 crash.
Investigate enough product claims, and a pattern emerges: the confident headline rarely matches the underlying evidence. It turns out the same is true for industries. And for marketplaces. And, as it happens, for the economy itself. This is the launch of Material Truths Macro, a new series that scales the same investigative methodology up from individual products to industries, marketplaces, and the broader consumer economy. Same questions. Larger claims.
We are starting with the largest one we could pick.
By every official measure, the economy is healthy. By every other measure, it is the worst in fifty years.
A look beyond the headline statistics, at consumer sentiment, household stress, AI dependency, and tail risks, to understand what is actually happening in the US economy and where it is headed through mid-2028.
Two Americas, one set of headlines.
The S&P 500 is at all-time highs. Unemployment is 4.3%. GDP is growing 2.0%. And yet the University of Michigan Consumer Sentiment Index just hit 44.8, an all-time low in the continuous series. Below the 1980 stagflation lows. Below 2008. Below the 2022 trough. Worse than COVID.
Something does not add up. Either consumers are wrong about their own lives, or the headline numbers are not capturing what is actually happening. This report makes the case that it is the latter.
The disconnect is not new in 2026, but it has never been this wide. To understand why requires looking past the indicators that get reported every Friday, and at the indicators that do not.
The Q1 2026 GDP print of 2.0% looks like an acceleration from Q4 2025's 0.5%. But the composition is troubling: imports surged as corporations stockpiled inventory ahead of expected tariff rulings (subtracting 2.62 percentage points from GDP, which then artificially showed up as inventory build). Federal compensation snapped back from the Q4 shutdown. And nearly all of the consumer spending growth came from healthcare, hospital visits, nursing home care, outpatient services, which is not discretionary. Strip out healthcare and the inventory/import gymnastics, and underlying private demand was much weaker than the 2.0% headline suggests.
The sentiment crash is real, and it is bipartisan.
Consumer sentiment matters because households make spending decisions based on their lived experience, not BLS press releases. The University of Michigan survey, running continuously since the late 1940s, just hit its lowest reading on record.
This is not partisan noise: Republican and Independent sentiment both hit lows during the Trump administration in May 2026. The drop is broad-based.
Both numbers are bad, but they signal different things. The 1-year expectation at 4.8% reflects immediate alarm about gas, food, and tariff-driven prices. The 5-year expectation at 3.9%, the highest in over a decade, is the more dangerous reading because the Fed considers long-run expectations its single most important credibility metric. When consumers expect higher prices for years, they demand higher wages; businesses raise prices preemptively; inflation becomes self-fulfilling. The Fed's entire credibility framework rests on keeping the 5-year number anchored near 2%. It is no longer anchored.
The reason consumers feel worse than the headline numbers suggest is straightforward: 57% of survey respondents in May 2026 spontaneously cited high prices as eroding their personal finances, up from 50% the prior month. The headline says inflation is 3.8%. The lived experience is the cumulative price level, not the rate of change.
Inflation did not go away. Prices just stopped going up as fast.
The single most misleading framing in economic journalism is reporting inflation as a year-over-year rate. What actually happened to American households between 2020 and 2026 is a one-time price level reset of roughly 25%, on top of which prices continue to rise by 3% to 4% per year.
Average wages grew 22% over the same period, meaning the median worker has lost about 3% of purchasing power against the overall basket, and 25% of purchasing power against housing. For workers in the bottom half of the wage distribution, the gap is much wider.
An "average" middle-class household in 2020 paid roughly $1,500/month for housing, $800 for food, $150 for electricity, and $150 for auto insurance. In 2026, the same household pays roughly $1,920 for housing, $1,008 for food, $207 for electricity, and $255 for auto insurance. That is $790 more per month, about $9,500 more per year, for the same lifestyle. Wages went up too, but not by that much, and not for everyone equally.
And now inflation has re-accelerated. April 2026 CPI hit 3.8%, the highest reading since May 2023, driven by a 17.9% YoY surge in energy and 28.4% surge in gasoline tied to the Iran war. This is happening into a softening labor market, which means the Fed faces a genuine stagflation trade-off for the first time since 1980.
The Federal Reserve does not target CPI, it targets the Personal Consumption Expenditures (PCE) price index, which has its own dynamics. In March 2026, PCE was 3.5% headline and 3.2% core year-over-year. But the Q1 2026 quarterly annualized PCE price index ran at roughly 4.5%, more than double the Fed's 2% target. This is the number that actually constrains the Fed's ability to cut rates, and it is getting worse, not better.
There is no single "American consumer" anymore. There are two.
The post-COVID economy has produced the most concentrated consumer spending pattern in modern US history. The top 10% of earners now account for approximately 46% of consumer spending. Since January 2023, they have driven roughly 80% of all spending growth.
This concentration is not just a fairness issue, it is a structural fragility. The US economy now depends on the top 10% maintaining their spending levels, which depends largely on their stock portfolios staying up, which depends increasingly on a small number of AI-related companies continuing to perform.
In 2008, broad-based employment was the transmission mechanism: when jobs were lost, spending fell, and the cycle compounded. In 2026, asset prices are the transmission mechanism, and a much smaller number of assets at that. The economy and the stock market are now more tightly coupled than at any point in modern history.
4.3% unemployment hides what is actually happening to jobs.
The headline unemployment rate (U-3) at 4.3% is technically healthy. But it captures only people actively looking for work. The broader U-6 measure, which includes involuntary part-time workers and discouraged workers, is at 7.7%, and the gap between them has been widening, which is the signature of an "employed but downgraded" labor market.
The most striking labor market shift in 40 years
For the first time in at least four decades, recent college graduates (ages 22-27) have higher unemployment than the overall workforce. Historically grads had a structural ~1 percentage point advantage. That gap has now inverted.
Stanford's Digital Economy Lab found early-career workers in AI-exposed roles (software development, marketing, sales) saw 16% slower employment growth than less-exposed peers between mid-2024 and September 2025. The "Information" sector specifically has lost 342,000 jobs (-11%) since November 2022, the month ChatGPT launched. Causation is debatable, but the timing is striking.
The AI displacement signal is getting hard to dismiss
For most of 2024 and 2025, the question of whether AI was actually eliminating jobs was contested. As of early 2026, the data is no longer ambiguous.
AI was the single largest cited reason for layoffs in both March and April 2026. Challenger's running tally of explicitly AI-attributed layoffs in 2026 hit 49,135 by mid-May, already approaching the entire 2025 total (~55,000) in less than five months. The named companies are not small: Amazon (14,000 corporate roles), Accenture (~11,000), Microsoft, Citigroup, Dell, Intel, TCS, UPS, and Workday (8.5% of workforce) have all explicitly cited AI in workforce reductions.
The displacement pattern is consistent and worth naming. It is concentrated in white-collar entry-level work: customer support, software programming, marketing, finance, consulting, and back-office roles. These are precisely the jobs the labor market had relied on as the on-ramp for college graduates and early-career professionals. They are being eliminated faster than new categories of work are being created.
A second-order effect worth tracking: AI is also reshaping software demand. When a customer can build a custom tool with an LLM in an afternoon, the rationale for paying $30/seat/month for a SaaS product weakens. Enterprise SaaS contraction is now visible in Workday, Salesforce, and Workday's own commentary about "reallocating" toward AI investment. If the AI capex thesis fails to materialize revenue (Section 07), and AI simultaneously eats existing SaaS revenue, the damage to enterprise software earnings is bilateral. This is the SaaS layer of the same problem.
The housing lock-in effect is breaking labor mobility
There is a second labor market dynamic that almost never gets reported but matters enormously: workers cannot move for better jobs anymore. Roughly 50% of outstanding US mortgages carry rates under 4%, locked in during the 2020-2021 refinancing boom. Current 30-year rates are 6.5-7%. Selling a home and buying a new one in a different city now adds hundreds of dollars per month to the same family's housing costs, often more than the wage gain from the new job.
An FHFA study found lock-in is responsible for a 57% reduction in home sales. Federal Reserve research found mortgage rate lock-in explains 44% of the drop in mortgage borrower mobility since 2022. Household mobility (the share of people moving in a given year) just hit its lowest rate on record.
This matters for two reasons. First, it is a hidden tax on the labor market: workers who would otherwise relocate for higher-paying jobs are stuck where they are. Companies in tight labor markets cannot fill positions; workers in slack markets cannot access better ones. Second, it compounds the K-shape. Homeowners locked into 3% mortgages are sitting on enormous unrealized wealth. Renters, who skew younger and lower-income, are stuck paying market rents with no equity upside and no mobility benefit. The wealth gap between the two groups widens every month.
The data nobody reports on tells a clearer story than the data that gets headlines.
Beyond the official statistics, there is a constellation of indirect indicators (what people spend on, what they delay, what they cancel) that reveals more about household stress than any monthly press release.
Auto loan delinquencies have reached crisis levels, at half the crisis unemployment rate
This is the single most underrated indicator in the entire economy right now.
People prioritize their car payment above almost everything except mortgage and food, because they need it to get to work. When 5.2% of auto loans are 90+ days delinquent, it means the bottom half of the income distribution has run out of buffer. Historically, this rate hits 5% only when unemployment is 8%+. Either delinquencies normalize down (requires real wage growth that is not happening) or unemployment catches up.
The 5.2% figure measures the total stock of auto loans currently 90+ days delinquent, directly comparable to the GFC peak of 5.3%. The NY Fed's other measure, the quarterly flow of accounts newly entering serious delinquency, was 2.97% in Q1 2026, roughly flat with a year ago. The flow stabilizing is a glimmer of good news. The stock at GFC levels is the bad news. Both are true.
Credit cards, the bigger story than BNPL
Total US credit card debt sits at $1.252 trillion in Q1 2026, slightly off the Q4 2025 record of $1.277 trillion (a seasonal drop that happens every year), but still 35% above the pre-pandemic peak. The real story is not the headline number; it is what is happening underneath.
At a 21% APR, a $6,800 average balance generates about $1,760 per year in interest payments, for many households more than they pay for gas or electricity. About 60% of credit card users carry a balance month-to-month, meaning they are paying that compounding 21% rate on essentials.
Birth rates and household formation
When young adults cannot afford housing, cannot predict their income trajectory, and do not trust their long-term economic prospects, they do not form households or have children. Birth and marriage rates are downstream of economic confidence. Both are at multi-decade lows.
Las Vegas, the canary nobody listens to
Las Vegas had 38.5 million visitors in 2025, down 7.5% from 2024. Hotel occupancy fell to 80.3%, average daily rate down 5%, RevPAR down 8.8%. Strip gaming win fell 11% YoY in January 2026. The only thing keeping 2026 from looking worse is the triennial Conexpo construction trade show. Strip that out and visitation is flat. The recovery is convention-led, not leisure-led, exactly what would be expected in a K-shaped economy where corporate spending is intact but middle-class discretionary travel is being cut.
Luxury, diverging by tier
LVMH posted 2025 revenue of €80.8 billion, down 1% organic. Fashion & leather goods down 5%. Q1 2026 growth was just 1%, missing expectations. The Iran war cost about 1 percentage point of growth in the quarter. Hermès and Brunello Cucinelli, which serve the very top of the wealth pyramid, continue to grow double-digits. Aspirational luxury, the middle-class "treat yourself" tier, is breaking. True ultra-luxury is fine. Another K-shape data point.
Other signals worth noting
- Used car prices: The strongest-performing wholesale segment is 8+ year-old vehicles. People are extending vehicle ownership rather than upgrading, a classic affordability-stress signal.
- Average new vehicle: $49,461 transaction price, 9.45% auto loan rate. The math no longer works for most households.
- Insurance: California Realtors report 13% of 2025 home sales failed because buyers could not secure insurance, double the prior year. Florida home insurance averaged $6,000 in 2025, up 200% from 2019.
- ACA premiums: Out-of-pocket health insurance premiums rose 58% in 2026 as enhanced subsidies expired.
- 401(k) match suspensions: Employers quietly suspending matches, last seen in 2008 and 2020.
About 2% of US GDP is now coming from seven companies' AI spending.
The single most important fact about the US economy in 2026 is the scale of AI infrastructure spending. Hyperscaler capex is projected at approximately $646 billion in 2026 (per Apollo's Torsten Slok), with about 75%, roughly $485 billion, going directly to AI infrastructure.
To put this in context: hyperscaler capex alone is now a larger share of GDP than the Apollo program and the Interstate Highway System combined. Total tech equipment + software investment in 2025 was about 4.4% of GDP, approaching the dot-com peak of roughly 5%.
The unit economics problem
Direct AI services generated roughly $25 billion in revenue in 2025 against more than $250 billion in infrastructure spending that year, about 10 cents of revenue per dollar of capex. The gap is the entire bull-bear debate in one number. Goldman Sachs has warned that justifying the current pace of spending would eventually require on the order of $1 trillion in annual AI profit, against a consensus industry revenue estimate closer to $450 billion. By either measure, the math does not yet close. Either AI revenue accelerates dramatically over the next 18 to 24 months, or the capex thesis cracks.
If AI ROI disappoints, the economy gets hit through two parallel mechanisms: (1) Mag 7 stocks fall → top decile portfolios shrink → top decile spending drops → 46% of consumer spending hit (the "wealth effect" chain). And (2) hyperscaler capex is cut → ~2% of GDP evaporates directly → semis, power, data center construction all crash → tech employment collapses (the "direct capex" chain). The trigger for both is the same, which is what makes the unwind correlated and fast.
You are not investing in "the market." You are investing in seven companies.
The top 10 S&P 500 companies now account for approximately 41% of total index weight, more than double their share from a decade ago, and well above the 25% peak during the 2000 dot-com bubble. The "Magnificent 7" alone represent about 35% of the index and are collectively worth roughly $18.5 trillion, about four times the combined value of all 2,000 companies in the Russell 2000.
By the most reliable long-term valuation metrics, US equities are at the second-most-expensive level in 154 years, exceeded only by the dot-com peak. Apollo's Torsten Slok has called it "historically extreme."
Wall Street's official 2026 forecasts are bullish: Goldman Sachs targets the S&P 500 at 7,600 by year-end 2026 (about a 12% total return), based on 12% earnings growth. But these are 12-month tactical forecasts. The valuation-based math tells a different long-run story: a Shiller CAPE of 40+ has historically implied annualized returns of only about 1-2% over the following decade. Both can be true. Short-term momentum can carry an expensive market higher; long-term math is brutal.
The largest tax increase in nearly a century, hiding in CPI.
The effective US tariff rate jumped from less than 2% (the historical norm from 2000-2024) to approximately 16.8% in 2025-2026, the largest tariff regime since the Smoot-Hawley era of the 1930s.
Both NY Fed and SF Fed research has confirmed that approximately 90% of tariff costs pass through to consumer prices, with a roughly 7-month lag. This means much of the inflation impact from 2025 tariff policy is still working its way through the system in 2026.
The Tax Foundation estimates the tariff regime is equivalent to approximately a $1,500 annual tax increase per household in 2026. The Yale Budget Lab's number is even higher at $2,100 per household in real income loss after consumers substitute toward cheaper goods. It is, in practical effect, the largest tax increase as a percentage of GDP since 1993.
The Yale Budget Lab also estimates that the 2025 tariffs will add approximately 0.7 percentage points to the unemployment rate by end-2026. This connects two seemingly separate threads in the report: tariffs are not just an inflation problem, they are directly feeding into the Sahm Rule's recession indicator. If unemployment drifts from 4.3% to roughly 5.0% over the next 12 months, tariffs alone could account for the entirety of that move.
The single biggest tail risk in the global economy, and the US is less prepared than it claims.
Despite over $165 billion of TSMC investment in Arizona and dozens of CHIPS Act announcements, the operational reality of US semiconductor independence by 2028 is much further off than political narratives suggest.
What is actually made in the US in 2026
- Leading-edge chips (3nm and below): 0% currently made in the US. TSMC Arizona Phase 1 produces 4nm chips, which by 2026 standards is a generation behind. Phase 2 (3nm) targets 2027.
- Advanced packaging (CoWoS): ~95% of CoWoS, essential for every Nvidia AI accelerator, remains in Taiwan. Amkor's Arizona facility will not reach scale until late 2027 / 2028.
- Apple's Arizona purchases: ~100M chips in 2026, roughly 20% of Apple's chip volume, all on a trailing-edge node.
- Intel 18A (the domestic backup): Yields still below profitability. Intel publicly threatening to exit leading-edge entirely if no major foundry customer signs for 14A.
- HBM memory (separate chokepoint): SK Hynix 57%, Samsung 22%, Micron 21%, almost entirely South Korea. Sold out through 2026.
The military and economic stakes
Even under aggressive ramp scenarios, less than 10-15% of true leading-edge logic for US AI, Apple, and Nvidia products will be made in the US by 2028. Advanced packaging onshoring is even slower, probably 15-20% by 2028. A Taiwan event between 2026 and 2028 would devastate the AI capex thesis with no fast substitute available. The deterrent is largely economic, not military, but US-China supply chain integration is so deep that "Russia-style" sanctions would inflict massive self-harm.
Interest on the national debt now exceeds defense spending.
The fiscal arithmetic is now mechanical: as long as deficits run 5-7% of GDP and interest rates stay above 4%, debt service compounds faster than tax revenue grows. The CBO projects interest payments will exceed Medicare in 2028 and become the second-largest federal expenditure after Social Security.
This matters for the economy because it constrains every other policy response. In every prior recession (2001, 2008, 2020), the federal government had fiscal room to respond aggressively. By 2027-2028, that room will be significantly tighter, both because of the debt level itself and because of the political pressure that comes with interest costs visibly competing with other priorities.
$1.35 trillion in corporate debt comes due in 2026, at twice the interest rate it was issued at.
This may be the single most important "what breaks first" question in the economy, and it is getting almost no media attention. American corporations spent the 2020-2021 zero-rate era issuing massive amounts of cheap debt. That debt is now maturing into a 4.5% Treasury and 7%+ corporate yield environment.
Throughout 2025, corporate treasurers kicked the can down the road, assuming the Fed would deliver multiple rate cuts in 2026 that would let them refinance cheaply. Those cuts never came. As the 10-year Treasury climbed back to 4.5%+ in March 2026 on Iran war oil pressure and stubborn inflation, the math snapped: companies now have to refinance at rates that crush their interest coverage ratios.
The zombie company problem
A meaningful percentage of US corporations are "zombies", companies whose operating earnings do not cover their interest expense, kept alive only by their ability to perpetually refinance. The post-COVID era of free money created a lot of them. They are now facing an existential filter.
When a zombie company cannot refinance, it does not just fail quietly. It triggers covenant breaches, fire-sale asset disposals, layoffs, and losses to creditors, including the private credit funds, leveraged loan vehicles, and the regional banks that hold commercial real estate debt. The chain matters: corporate defaults → credit fund losses → redemption gates → forced selling of liquid assets → equity market pressure → wealth effect → consumer spending hit.
If asked "what specifically would tip the base case into the mild recession scenario," the answer is almost certainly here. The Fed cannot cut aggressively because inflation is still 3.8%. Corporate spreads keep widening. Each month that passes without rate cuts forces more refinancings at punitive rates. At some point, a high-profile company (or a cluster of them) defaults, spreads blow out further, private credit funds start gating redemptions, and the cycle compounds. This is the textbook 2026-2027 recession pathway, and it is already partially unfolding, with HY spreads at 470bp this March.
What makes this different from 2008 is the location of the leverage. In 2008, the leverage was in household mortgages and bank balance sheets, both heavily regulated channels that got the bailout treatment. In 2026, the leverage is in corporate bonds, leveraged loans, private credit, and CRE, much of it held outside the regulated banking system, in vehicles that are harder to bail out and faster to gate redemptions. The transmission is less catastrophic but also less containable.
Office CMBS delinquencies just hit an all-time record, higher than the 2008 financial crisis peak.
If the corporate refinancing wall is the most likely first crack, commercial real estate is the slow-motion accident running parallel to it. The two are connected: regional and community banks hold roughly 36% of the $5 trillion in US commercial real estate debt, and they are the same banks that lend to small businesses.
The office CMBS delinquency rate hit 12.34% in January 2026, the highest level since Trepp began tracking it in 2000, and nearly two percentage points above the worst readings during the 2008 financial crisis. Office values are down 30-50% from their 2021 peaks, with $929 billion in CRE loans maturing in 2024 and a comparable wall continuing through 2026. Morningstar projects more than half of the roughly $100 billion in 2026 securitized commercial mortgages will fail to pay off at maturity.
Why "extend and pretend" is finally breaking
Since 2023, lenders have used "extend and pretend", repeatedly extending the maturity of distressed CRE loans rather than forcing defaults, hoping rates would fall and values would recover. Neither happened. Pandemic-era 3% rates are not coming back. Hybrid work has permanently reduced demand for most office space. Lenders are finally accepting that values are not coming back and beginning to mark assets to market.
This is where CRE intersects with the broader economy. Regional and community banks hold the largest concentration of CRE debt, roughly 25% of total bank mortgage balances. Many of these are the same institutions that lend to small businesses and provide consumer credit in their communities. As CRE losses force these banks to tighten lending and shore up capital, the credit squeeze hits Main Street, small business hiring, construction, local consumer credit. The S&P Global CRE maturity wall peaks at $1.26 trillion in 2027. The full impact of "extend and pretend" finally breaking will play out over the next 24 months.
The good news is that this is not 2008-scale leverage. CRE concentration in the banking system is meaningful but not systemic, the FDIC has dealt with regional bank failures (First Republic, Signature, Silicon Valley) and the framework exists to do it again. The bad news is that even contained CRE stress will quietly drag on credit creation, small business hiring, and local economies for the rest of the decade.
The dollar is down about 10% on a trade-weighted basis in 2025, and that is both helping and hurting.
The US Dollar Index (DXY) fell to a four-year low around 96.5 in early 2026, having lost roughly 10% on a trade-weighted basis since the start of Trump's second term. Against individual currencies, the moves are larger: -13.5% vs the euro, -13.9% vs the Swiss franc, -6.4% vs the yen. This is the weakest dollar in over a decade.
Why this matters in both directions:
- It is inflationary at home. A weaker dollar makes imports more expensive, adding fuel to the existing inflation problem on top of tariffs and the Iran oil shock.
- It is supportive of US exports. American goods become more competitive abroad, which marginally helps manufacturing and the trade balance.
- It could be an early warning. The US runs $1.9 trillion annual deficits funded largely by foreign capital. Dollar weakness paired with rising Treasury yields would signal foreign investors demanding more compensation to hold US debt, a more concerning signal than dollar weakness alone.
Most analysts (Brookings, Schwab, ING) say there is "very little evidence" that reserve managers are actively exiting the dollar. There is no viable alternative reserve currency. The current weakness probably reflects growth and rate differentials more than any structural loss of reserve status. But for an economy that increasingly depends on foreign capital inflows to finance AI capex and federal deficits, dollar weakness is a structural vulnerability worth tracking, especially if it persists alongside rising long-term yields, which would be the actual warning signal.
Every major economy is growing below trend. Simultaneously.
The major flashpoints
- Germany has had three consecutive years of stagnation or recession. Industrial production is 15% below the 2017 peak. VW cutting 35,000 jobs, Bosch 22,000, ThyssenKrupp 11,000. The €500B infrastructure fund and defense ramp cannot offset structural energy disadvantage and Chinese EV competition.
- European Union as a whole. The EU Commission's Spring 2026 forecast cut EU GDP growth to 1.1% (from 1.5% in 2025), with inflation revised upward to 3.1%. Eurozone consumer confidence is at a 40-month low. The Iran energy shock alone is estimated to cost the EU an additional €6 billion in fossil fuel imports in just the first 17 days of the crisis.
- China is in a deflationary spiral. Producer prices declined for 41 consecutive months before the Iran-driven energy bounce. ~85% of post-2021 real estate price gains have been erased. Independent estimates put real GDP growth at 2.5-3.5%, far below the official 5%.
- France recorded 69,000 business failures in 2025, exceeding the 2009 GFC record. Ongoing fiscal and political crisis.
- Russia-Ukraine war continues into its fifth year. Ukraine's Q1 2026 GDP fell 0.5% year-over-year as Russian attacks on energy infrastructure intensified. The EU has now passed 20 rounds of sanctions. European energy prices remain roughly 20% above pre-war levels in 2026, structurally elevating the EU's cost base relative to the US and Asia.
- Japan is finally raising rates. The Bank of Japan lifted the policy rate to 0.75% in December 2025, with a hike to 1.0% expected in June 2026. The 10-year JGB yield has climbed to roughly 2.8%, the highest since 1997. Japan sold roughly $30 billion of US Treasuries in Q1 2026 alone, the fastest pace in four years.
- Iran war ongoing since March/April 2026. Brent ~$97. Gasoline +47% since end-February. Strait of Hormuz operationally disrupted.
For over a decade, investors borrowed yen at near-zero rates and invested in higher-yielding assets globally, including US tech stocks, Treasuries, and crypto. Morgan Stanley estimates the outstanding positions at roughly $500 billion. As Japanese rates and JGB yields rise, the math of the trade deteriorates: investors who borrowed yen must buy yen back to repay loans, which strengthens the yen, which makes the trade more expensive, which triggers more unwinding. In August 2024, a smaller-scale BOJ hike triggered a yen carry trade unwind that crashed bitcoin from $64,000 to $49,000 in 48 hours and caused broader risk-asset selloffs. With the BOJ now in a clear hiking cycle and Japan already net-selling US Treasuries, the conditions for another, larger unwind are quietly building.
The synchronized slowdown matters because it reduces the global economy's resilience to any single shock. Normally a recession in one region can be cushioned by growth elsewhere. In 2026, there is no "elsewhere."
The most reliable recession indicators are all flashing yellow or red.
Economists have a handful of indicators with strong track records of predicting recessions before they are officially called. As of May 2026, three of the four most reliable are all in warning territory simultaneously.
| Indicator | Track record | Current reading | Status |
|---|---|---|---|
| Sahm Rule | 100% accuracy since 1970 | 0.47 (0.50 = trigger) | Approaching |
| Conf. Board LEI 3Ds | >85% recession hit rate when triggered | 97.4, -0.7% over 6mo | Triggered |
| Yield curve (2s10s) | Re-steepening signals recession start | +0.21pp (after 24mo inversion) | Re-steepened |
| NFIB Optimism | <96 + Uncertainty >85 reliable | 95.9 / Uncertainty 88 | Below trend |
| Auto delinquencies | Limited historical analog | 5.2% (at GFC peak) | Unprecedented |
| U-Mich Sentiment | Major recessions follow troughs | 44.8 (all-time low) | Record low |
Having three of the most reliable recession indicators in warning territory simultaneously, without a recession having occurred, would be historically unprecedented. Either the indicators are wrong (possible, labor market dynamics may have changed) or a recession is already underway and just has not been officially called yet (NBER typically dates recessions ~12 months in arrears).
Combining all of these, recession probability for the next 12 months appears to be in the 30-35% range, between Goldman Sachs at 25-30% and Moody's at ~50%, with the consensus average sitting at 35.2%. Historical baseline recession probability in any given 12-month period is approximately 14-16%.
Four scenarios for the next 24 months.
Given the unusual configuration of conditions in May 2026, here are the four most plausible paths through mid-2028, with rough probabilities:
Even adding the bull and base case probabilities (70%), the equity upside in those scenarios (+10-15% in the bull, flat in the base) is much smaller than the downside in the recession and crisis cases (-20% to -45%). Mathematically: a 30% chance of -25% is a -7.5% expected return; a 70% chance of +5% is +3.5%. The math currently favors caution, not because the worst case is likely, but because the upside no longer compensates for the downside.
The signals that will tell you which scenario is unfolding.
Rather than refresh the news cycle daily, here are the few monthly and quarterly indicators that actually carry signal about which path the economy is on:
Monthly
- Sahm Rule (first Friday with jobs report). If it crosses 0.50, recession has functionally begun.
- U-Mich 5-year inflation expectations (pre and final). If it un-anchors above 4%, the Fed has lost the plot
- ISM Manufacturing PMI components. Watch employment subindex (currently 46.4, contracting 31 straight months)
- NFIB Optimism Index (second Tuesday). Main Street health; below 90 is a recession signal.
- Cass Freight Shipments Index (around the 13th). Real goods movement, hard data.
- CPI energy component. Iran war transmission
Quarterly
- AI hyperscaler capex guidance (Microsoft, Google, Meta, Amazon, Oracle earnings). Single biggest GDP swing variable.
- TSMC monthly revenue and CoWoS commentary. Real-time gauge of AI demand and Taiwan dependency
- NY Fed Household Debt Report. Auto loan and credit card delinquencies; watch the stock-vs-flow distinction
- Trepp CMBS Office Delinquency Rate. Currently at 12.34% record; watch for spillover to regional bank earnings
- Private credit BDC NAV reports. Early warning for the next credit shoe
Daily / continuous
- High-yield credit spreads (HY OAS). Already at 470bp, above the 450bp warning threshold. Watch for sustained moves above 500bp as the corporate refinancing wall hits.
- Brent crude and Hormuz status. Biggest exogenous swing factor
- USD/JPY exchange rate and JGB 10-year yield. Sustained yen strength below 140 paired with JGB yields above 3% would signal accelerating carry trade unwind.
- 10-year Treasury term premium. Fiscal stress signal; watch alongside the DXY
- US Dollar Index (DXY). Sustained moves below 95 paired with rising yields would signal real foreign capital concern
- Challenger monthly layoff reports. Track AI-attributed layoffs as a share of total. Above 30% of monthly cuts would mark a clear inflection in white-collar displacement.
The Sahm Rule, AI hyperscaler capex guidance, and high-yield credit spreads. If Sahm crosses 0.50, recession has started. If hyperscalers cut capex guidance, the most important growth engine cracks. If HY spreads widen above 450bp, credit markets are pricing in real stress. Any one of these would be a major signal. All three together would be conclusive.
The numbers tell a story. It is just not the one most people are being told.
The US economy in May 2026 looks healthy on the surface and unhealthy almost everywhere else. The gap between the two pictures is the largest in modern history, and the data is no longer ambiguous about which side is bigger.
None of this is a prediction. The base case remains a slow grind: below-trend growth, sticky inflation, a Fed that cannot cut aggressively, and a top decile that keeps the headline economy intact while the bottom 80% deteriorates quietly. That is the muddle-through. It is still the most likely path.
What has changed is the cost of being wrong. With consumer sentiment at a record low, auto delinquencies at the 2008 peak, $1.35 trillion in corporate debt refinancing at twice the rate it was issued at, and office defaults at all-time highs, the risk case no longer requires anything exotic to trigger. It requires only one of the existing cracks to widen. The most likely candidate, based on the data, is corporate refinancing. Behind it sit the larger tail risks: an AI capex pause, a Taiwan event, an oil shock that lingers.
The official numbers are not lying. They are just measuring a different country than the one most Americans live in.
All data in this report is drawn from primary sources: government statistical agencies, peer-reviewed research, established financial-data providers, and major financial publications. Grouped by section below.
Macro indicators & consumer sentiment
- US Bureau of Labor Statistics, Employment Situation (April 2026); Consumer Price Index (April 2026)
- US Bureau of Economic Analysis, Gross Domestic Product (Q1 2026 advance estimate); PCE Price Index
- University of Michigan, Surveys of Consumers (May 2026 final reading)
- Federal Reserve Economic Data (FRED), St. Louis Fed
Household stress & the K-shape
- Federal Reserve Bank of New York, Quarterly Report on Household Debt and Credit (Q1 2026)
- Moody's Analytics consumer spending by income decile
- Federal Reserve Board, Survey of Consumer Finances
- Federal Housing Finance Agency (FHFA), mortgage rate lock-in research
- National Bureau of Economic Research, NBER working papers on housing lock-in and mobility
- CDC National Center for Health Statistics, US fertility rate
Labor market & AI displacement
- Stanford Digital Economy Lab, AI-exposed occupations employment study
- Challenger, Gray & Christmas, Job Cuts Report (monthly, through May 2026)
- Goldman Sachs Research, AI labor market estimates
- NY Fed, The Labor Market for Recent College Graduates
AI capex & valuations
- Apollo Global Management, Torsten Sløk's The Daily Spark
- Goldman Sachs Research, AI infrastructure capex and revenue analysis
- Hyperscaler 10-Q filings (Microsoft, Alphabet, Meta, Amazon, Oracle)
- Robert Shiller, CAPE ratio data (Yale)
- S&P Dow Jones Indices, index concentration data
- The Kobeissi Letter, market concentration reporting
Tariffs & trade
- Yale Budget Lab, tariff impact analysis
- Tax Foundation, tariff regime analysis
- Federal Reserve Bank of New York, Liberty Street Economics on tariff pass-through
- Federal Reserve Bank of San Francisco, tariff pass-through research
Taiwan & semiconductors
- SemiAnalysis, semiconductor industry analysis
- TrendForce, advanced packaging and HBM data
- Bloomberg Economics, Taiwan war scenario modeling
- US Office of the Director of National Intelligence, Annual Threat Assessment
- TSMC quarterly earnings reports
Debt, credit & commercial real estate
- US Treasury, Federal Debt & Interest Expense
- Congressional Budget Office, Budget and Economic Outlook
- Moody's Investors Service, corporate debt maturity wall data
- ICE BofA US High Yield Index Option-Adjusted Spread (via FRED)
- Trepp, CMBS Delinquency Report (January 2026)
- Morningstar DBRS, CRE maturity projections
- S&P Global Market Intelligence, CRE maturity wall data
Dollar, global, & carry trade
- Federal Reserve Board, Trade Weighted U.S. Dollar Index
- European Commission, Spring 2026 Economic Forecast
- European Bank for Reconstruction and Development, Regional Economic Prospects (Ukraine)
- Bank of Japan policy statements and JGB yield data
- Morgan Stanley research, yen carry trade positioning estimates
- American Enterprise Institute, carry trade analysis
- IMF, World Economic Outlook
Recession indicators & outlook
- Federal Reserve Bank of St. Louis, Sahm Recession Indicator
- The Conference Board, Leading Economic Index
- NFIB, Small Business Economic Trends
- Cass Information Systems, Freight Index Report
- Goldman Sachs Research and Moody's Analytics, recession probability estimates
Data current as of May 2026. This report is a journalistic synthesis of public data, not investment, legal, or financial advice. Where conflicting figures exist between primary and secondary sources, primary sources were used. Where ranges are cited, the range reflects genuine variance across credible methodologies.
This is the first investigation in the Material Truths Macro series. Subsequent pieces will examine the TikTok Shop economy, the "Made in America" supplement industry, and the wellness sector's $5 trillion claim, applying the same methodology to industries, marketplaces, and other claims that don't survive contact with the evidence. Subscribe to get them as they publish.